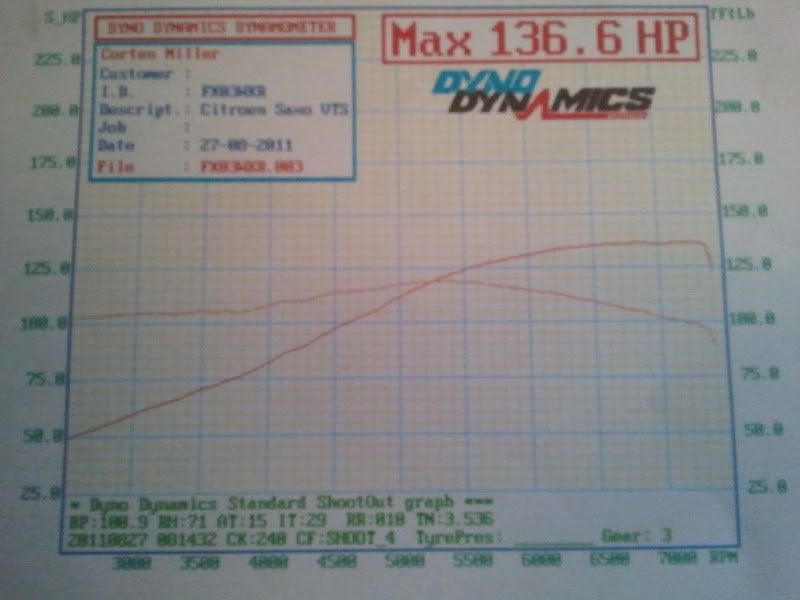
138bhp vts dyno graphs? Reviews

  1. #1
    16v engine few mods
    138bhp

    I'm not worried about the figure
    More bothered about the graph and lines

    Does it look like it's slightly overfueling?
    Lambda change do the jOb?

    Graphs
    Anyone fancy telling me what to look for in a good graph figure?

  2. #2
    few flat spots in there what mods have you done?
  3. #3
    Both graphs are different?
    4-1 piper mani
    Lightweight pulleys
    Saxsport
    Bmc
  4. #4
    my 2003 road car made this on a d,dynamics

    sportcat and ind kit nothing more, its close to your figure may be worth looking at?

  5. #5
    fuelling is allover the place
  6. #6
    question:
    WHich line shows fueling?
    is it suppose to be fueling up in a slow line or how can you tell?

    could it be the rollers that are crap or if what on car?
  7. #7
    First graph on your post show the feuling line. Should be alot smoother on full throttle.
  8. #8
    what would be making the fuel line be slightly out?
    lambda? map?
  9. #9
    lambda is disregarded on wot, so its something else.
  10. #10
    Get injectors cleaned
  11. #11
    the fuelling graph is wiggly because of the sample rate --the data logging speed,if the sampling rate per second were slower it would be a smoother line
  12. #12
    it's wiggling between 12.5 and 13.6

    There's room for improvement, certainly a flat 13.1:1 from 2000-7200rpm would be 'better' but you're inside the window

    Andy
    1 user thanked this post: